Analyzing data
Class CycleAnalyzer is used for calculating and plotting circadian cycles data.
For more info about the analysis methods, see the paper.
Here’s an example of analyzing randomly generated activity data.
[1]:
import numpy as np
from chronobiology.chronobiology import CycleAnalyzer, generate_data
[2]:
# Generate random activity data.
data = generate_data()

# Prepare input arrays for CycleAnalyzer.
# When working with InfluxDB, same arrays must be selected using a DBQuery instance.
timestamps = data['time'] # timestamps of measurements
values = data['value']    # activity values
nights = data['is_night'] # night activity markers

print(f'{len(timestamps)} measurements generated.')
np.set_printoptions(threshold=10)
data
870 measurements generated.
[2]:
{'time': array(['2020-01-01T00:03:00.000000000', '2020-01-01T03:29:00.000000000',
        '2020-01-01T03:53:00.000000000', ...,
        '2020-01-10T20:42:00.000000000', '2020-01-10T22:02:00.000000000',
        '2020-01-10T22:47:00.000000000'], dtype='datetime64[ns]'),
 'value': array([1, 1, 1, ..., 1, 1, 1]),
 'is_night': array([False,  True,  True, ...,  True,  True,  True])}
[3]:
# Create a cycle analyzer.
ca = CycleAnalyzer(timestamps, values, nights)
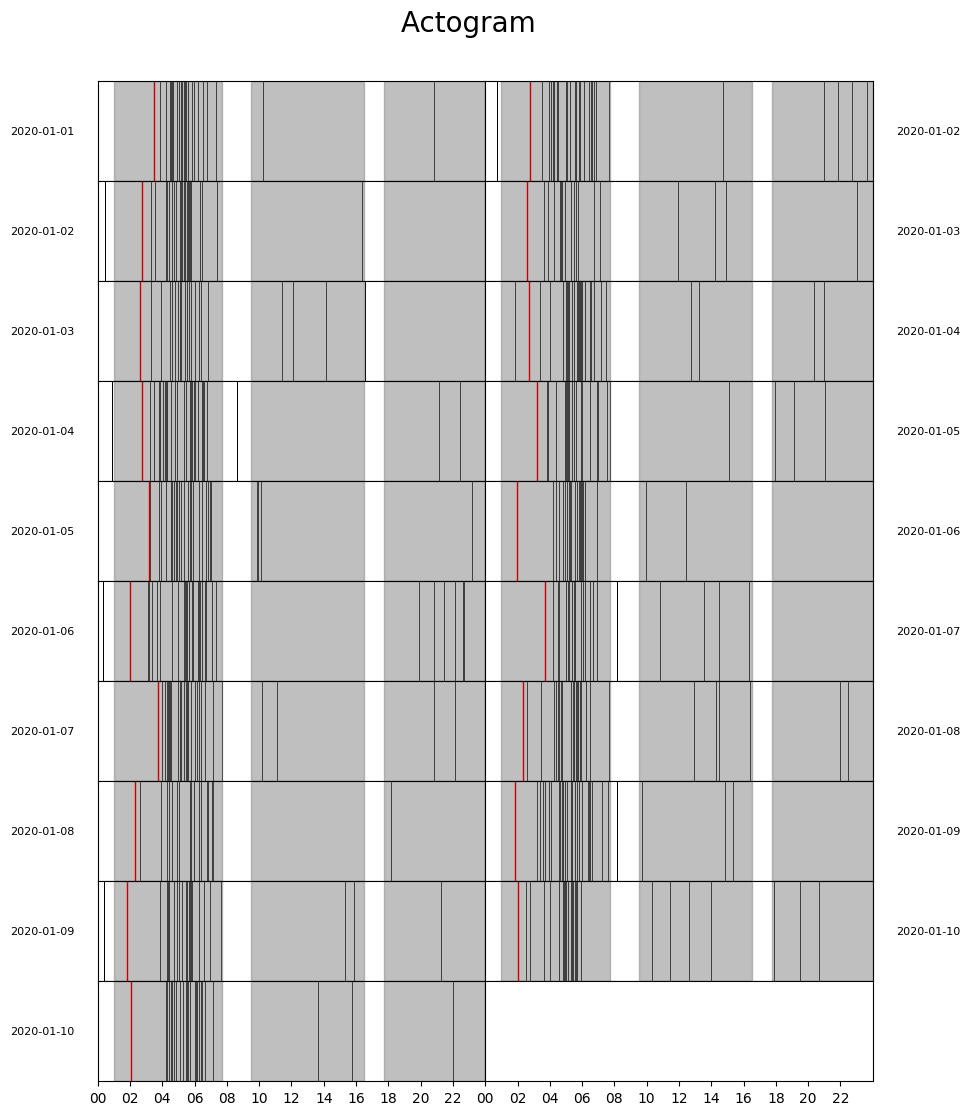
Actogram
The most obvious way of assessing circadian disruption is to simply look at experimental actograms. This visual inspection should always take the form of circadian disruption into account, and whether this is environmental or genetic in origin. This will also determine the appropriate controls, be they baseline conditions or wildtype littermates, respectively. Furthermore, when studying circadian disruption under different lighting paradigms, comparing activity relative to the external LD cycle is critical. This initial visual inspection of actogram data will guide the choice of which additional measurements are likely to be most informative.
[4]:
ca.plot_actogram()
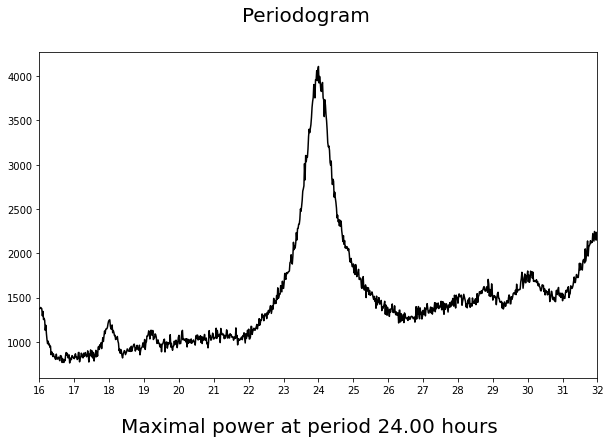
Periodogram
The power of a periodogram provides a measure of the strength and regularity of the underlying rhythm, with higher values indicating robust rhythms. In circadian disruption — where rhythms are typically less robust — periodogram power is expected to be reduced and low values may indicate the absence of a significant circadian rhythm. The power of the chi-square periodogram (\(Q_p\)) has been widely used as a measure of the robustness of circadian rhythms, and can be traced back to studies on the effects of constant light on the strength of activity and sleep rhythms in rats. Analysis of \(Q_p\) based upon simulated and empirical data sets has shown that this provides a valuable measure of the robustness of circadian rhythms. Periodogram analysis is particularly informative in internal desynchrony, where the power of multiple periodicities within a dataset will be evident.
[5]:
ca.plot_periodogram()
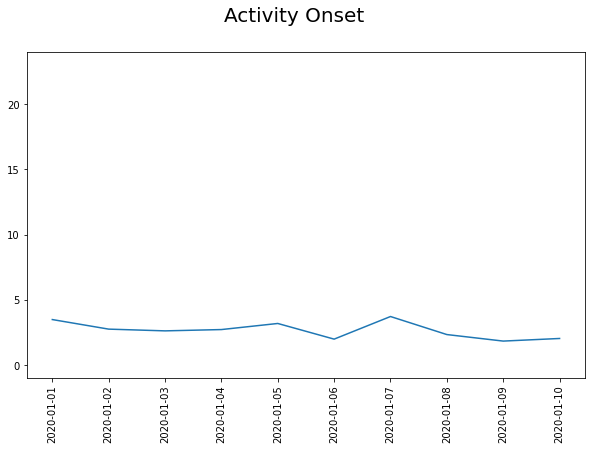
Activity oneset
A hallmark of normal circadian function is that activity onset is consistent from day to day. In most records, the onset of activity is typically a more precise phase marker than the offset of activity. As such, the variability in activity onset across multiple days – either relative to the light/dark cycle (phase angle of entrainment) or under constant conditions – provides a useful metric to describe the precision of circadian rhythms. Phase angle of entrainment and the variability in activity onset have been widely used in the study of circadian entrainment. Activity onset is particularly informative when studying circadian misalignment and chronodisruption, where the phasing of activity with regard to environmental zeitgebers is expected to differ.
[6]:
ca.activity_onset()
[6]:
array(['2020-01-01T03:29', '2020-01-02T02:45', '2020-01-03T02:37',
       '2020-01-04T02:43', '2020-01-05T03:11', '2020-01-06T01:59',
       '2020-01-07T03:43', '2020-01-08T02:20', '2020-01-09T01:50',
       '2020-01-10T02:02'], dtype='datetime64[m]')
[7]:
ca.plot_activity_onset()
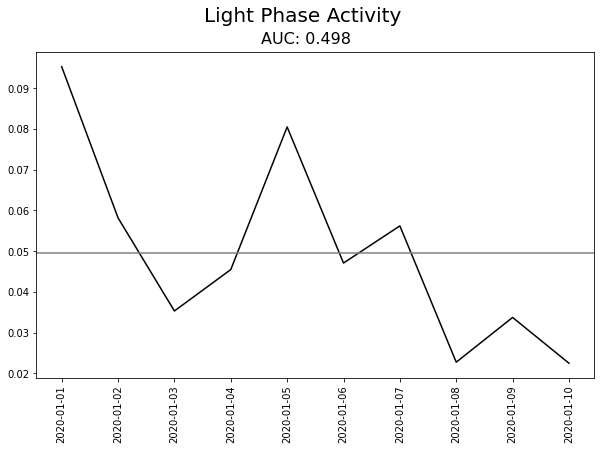
Light phase activity
In nocturnal species, such as laboratory mice, activity is normally confined to the dark phase of the light/dark cycle. A hallmark of disrupted rhythms is therefore an increased activity in the normally inactive light phase, and such changes are expected to occur in both circadian misalignment and chronodisruption. In diurnal species, dark phase activity can similarly be used to quantify the amount of activity occurring in the normal inactive phase. Light phase activity has been widely used to study defects in circadian entrainment to light as well as in disease-relevant models. Light phase activity also provides an ideal measure to assess the impact of misaligned feeding, a specific example of circadian misalignment.
[8]:
ca.light_activity(auc=True)
[8]:
(array([0.0952381 , 0.05813953, 0.03529412, 0.04545455, 0.08045977,
        0.04705882, 0.05617978, 0.02272727, 0.03370787, 0.02247191]),
 0.04942528735632184,
 0.4978093187109366)
[9]:
ca.plot_light_activity()
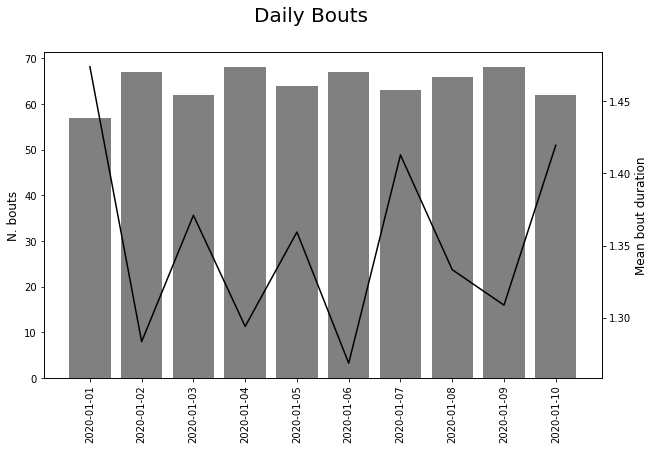
Activity bouts
As a result of less consolidated activity and rest phases, circadian disruption is associated with an increased number and reduced duration of activity bouts. The number and duration of activity bouts are frequently used as a measure of fragmentation in circadian disruption. Due to the inappropriate phasing of activity/rest cycles with regard to the external environmental, circadian misalignment, internal desynchrony and chronodisruption are all expected to affect activity bouts.
[10]:
ca.daily_bouts()
[10]:
(array([57, 67, 62, 68, 64, 67, 63, 66, 68, 62]),
 array([1.47368421, 1.28358209, 1.37096774, 1.29411765, 1.359375  ,
        1.26865672, 1.41269841, 1.33333333, 1.30882353, 1.41935484]))
[11]:
ca.plot_daily_bouts()
[12]:
ca.plot_bout_histogram()

Inter-daily stability
Inter-daily stability (IS) measures the day-to-day reproducibility of rest/activity cycles. Patterns of activity are typically reproducible in healthy individuals, whereas circadian disruption results in more variable rhythms. IS was first described in the study of elderly human patients with Alzheimer’s disease. It has subsequently been widely used in a number of human studies, and has also been adopted for studying circadian disruption in animal models. Due to the day-to-day changes in the relationship between circadian and environmental time, decreased IS may be expected in internal desynchrony. However, circadian misalignment and chronodisruption may not influence IS if a stable new phase-relationship is established.
[13]:
ca.interdaily_stability()
[13]:
0.9509106984969055
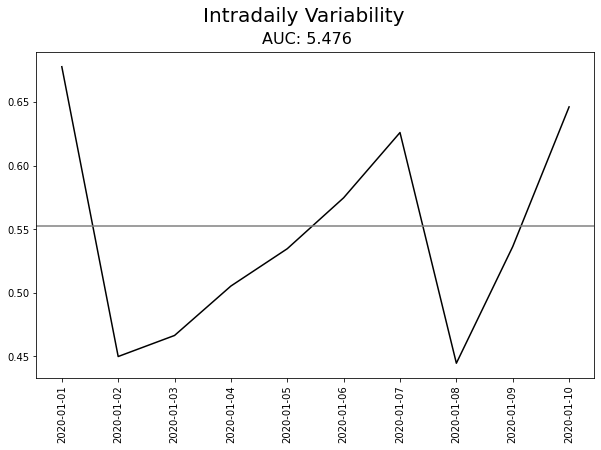
Intra-daily variability
Intra-daily variability (IV) is a measure of the fragmentation of activity rhythms. First introduced for the study of patients with Alzheimer’s disease, like IS it has been readily adopted for the study of animal models of circadian disruption. IV measures the frequency of transitions between activity and rest across the day. More transitions between activity and rest result in higher IV scores. As with activity bouts, circadian misalignment, internal desynchrony and chronodisruption may all increase IV due to the inappropriate phasing of activity/rest cycles with regard to the external environment. A good example of this occurs in aging, where IV increases steadily with age in mice.
[14]:
ca.intradaily_variability()
[14]:
(array([0.67764081, 0.44996891, 0.46650498, 0.50534161, 0.53465811,
        0.57466193, 0.62592347, 0.44469921, 0.53629512, 0.64607892]),
 0.5521986259617444)
[15]:
ca.plot_intradaily_variability()
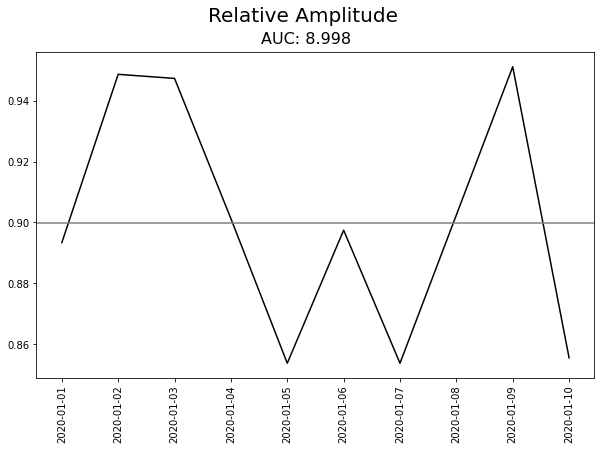
Relative amplitude
Perhaps the most obvious measure of the strength of any biological rhythm is its amplitude. A simple metric that has been widely used in human studies is relative amplitude (RA), again originating from studies in patients with Alzheimer’s disease. RA is a simple measure of the difference between periods of peak activity and rest. As healthy rhythms are assumed to display consolidated activity and rest periods, RA is expected to be reduced when normal circadian rhythms are disrupted. Both circadian misalignment and chronodisruption will reduce RA, with internal desynchrony potentially resulting in RA values that fluctuate as periods move in and out of phase.
[16]:
ca.relative_amplitude(auc=True)
[16]:
(array([0.89333333, 0.94871795, 0.94736842, 0.90123457, 0.85365854,
        0.8974359 , 0.85365854, 0.90243902, 0.95121951, 0.85542169]),
 0.8998748435544431,
 8.998188196576098)
[17]:
ca.plot_relative_amplitude()